Chrome DevTools is a set of tools built into Google Chrome. It helps web developers make better websites. Chrome DevTools lets you view and change parts of a webpage right in your browser. This makes it easier to fix problems and try new ideas quickly.
You can open DevTools in a few ways. The easiest is to right-click on a webpage and pick “Inspect” from the menu. You can also use keyboard shortcuts or find it in Chrome’s menu. Once open, you’ll see many panels with different tools.
These tools let you look at the page’s code, check for errors, and test how it works on different devices. You can even change the page’s look without touching the real code. This makes DevTools great for learning and fixing websites.
Keybinds
Chrome includes built-in developer tools – you don’t need to install anything to debug issues in the browser.
Apple OS X keybinding: ⌘⌥i (Cmd+Option+I)
Windows keybinding: Ctrl+Shift+I
The Power of Chrome DevTools
Elements Tab: Dissecting the DOM
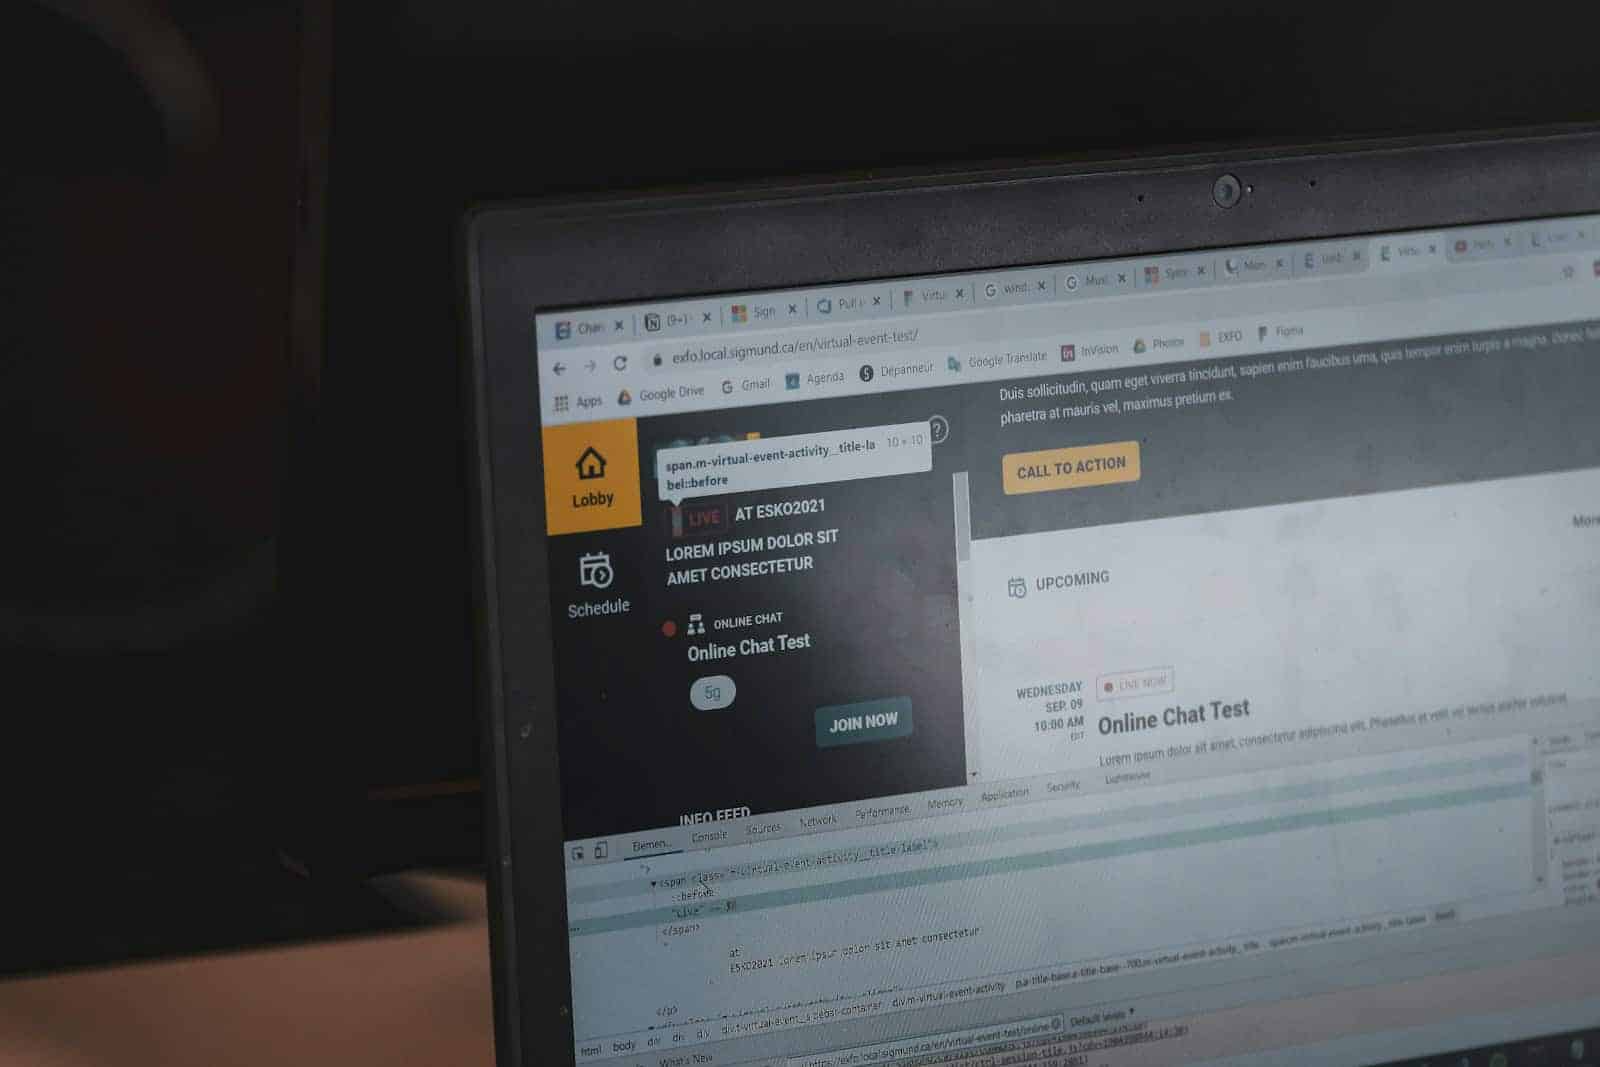
The Elements tab is your window into the Document Object Model (DOM), the hierarchical structure of a webpage. Here, you can inspect and modify HTML elements, their attributes, and the CSS styles applied to them.

Console Tab: Debugging and Interacting
The Console tab serves as a command center for debugging JavaScript code and interacting with the browser. You can log messages, view errors, and even execute JavaScript code snippets directly in the console.
Sources Tab: Debugging JavaScript in Detail
For in-depth JavaScript debugging, the Sources tab is your go-to. Here, you can set breakpoints, step through code execution, inspect variables, and even edit your code on the fly.
Network Tab: Monitoring Traffic
The Network tab provides a detailed log of all network requests made by the webpage. It’s invaluable for analyzing loading times, identifying bottlenecks, and optimizing performance.
Performance Tab: Profiling and Optimization
Want to make your website lightning fast? The Performance tab helps you analyze the performance of your webpage, identify areas for improvement, and optimize rendering, loading, and scripting.
Application Tab: Managing Storage and Data
The Application tab allows you to inspect and manage website data stored in various forms, such as local storage, session storage, cookies, and IndexedDB.
Security Tab: Ensuring Website Safety
The Security tab provides information about the security of a webpage, including its certificate details and connection information. It’s essential for ensuring that your website is secure and protects user data.
Other Notable Tabs
| Tab Name | Description |
|---|---|
| Lighthouse | Automate website audits for performance, accessibility, and best practices. |
| Memory | Profile memory usage and identify potential memory leaks. |
| Rendering | Visualize paint events and layer compositing for rendering optimization. |
| Recorder | Record user interactions and replay them for debugging or testing. |
Beyond the Basics
Chrome DevTools offers a plethora of additional features, such as the ability to simulate different devices, throttle network speed, and emulate different user agent strings. It’s a versatile toolkit that empowers web developers to build better, faster, and more reliable websites.
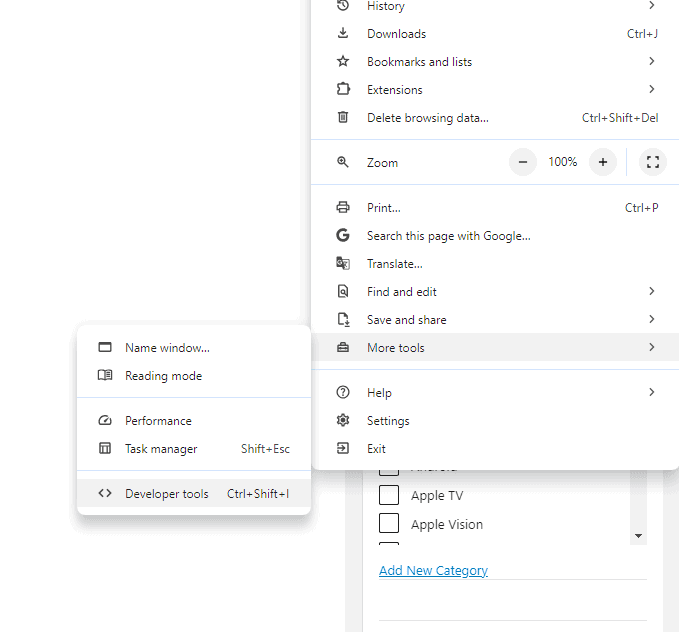
PC Instructions
Click the 3 Dots > More Tools > Developer Tools in the menu
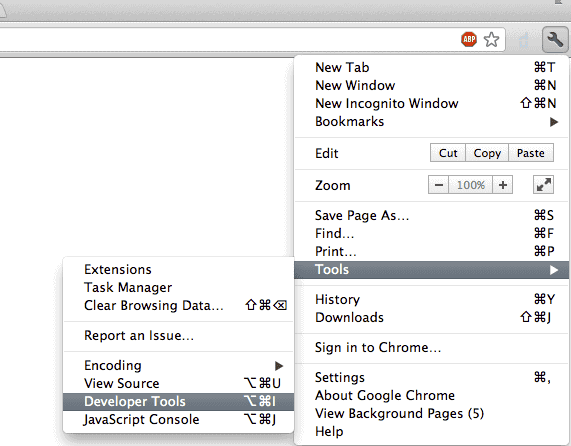
MacOS Instructions
Click Developer Tools in the wrench menu, tools, and Developer Tools
Key Takeaways
- Chrome DevTools is a set of tools in Google Chrome for web developers
- It helps you view and change webpages in real-time
- DevTools offers many features for testing and improving websites
Core Panels and Their Functions
Chrome DevTools has five main panels. Each panel helps web developers in different ways. They let you check and change parts of a website.
Elements Panel
The Elements panel shows the HTML and CSS of a web page. You can see how the page is built. It’s easy to change the code right in the browser. This helps when you want to test new designs quickly.
You can click on any part of the page to see its code. The panel shows the full HTML structure. It also displays all the CSS styles for each element. You can turn styles on and off to see what changes.
The Elements panel is great for fixing layout issues. It helps you find why things don’t look right. You can also use it to try new styles without changing your main files.
Console Panel
The Console panel is where you can run JavaScript code. It’s a place to test ideas and fix problems. The console shows errors and warnings from your web page. This helps you find and fix bugs fast.
You can type JavaScript directly into the console. It will run right away. This is useful for quick tests or calculations. The console also shows the results of your code.
Many developers use the console to check variable values. You can see what’s stored in your variables at any time. This helps when debugging complex code.
Sources Panel
The Sources panel is where you debug JavaScript. It shows all the files that make up your web page. You can set breakpoints in your code here. Breakpoints let you pause your code at certain spots.
This panel has a full code editor. You can make changes to your files right in DevTools. It’s helpful for testing fixes before you update your main files.
The Sources panel also lets you save small bits of code called Snippets. These are useful for tests you run often. You can save and run them on any web page.
Network Panel
The Network panel shows all the files a web page loads. It tells you how long each file takes to download. This helps you find slow parts of your site.
You can see details about each file. This includes its size, type, and where it came from. The panel also shows you the order files load in. This can help you make your site load faster.
There’s a feature to slow down your internet on purpose. This lets you test how your site works on slow connections. It’s useful for making sure your site works well for everyone.
Performance Panel
The Performance panel helps you make your website faster. It records what happens when your page loads or runs. Then it shows you a detailed report.
You can see how long different parts of your code take to run. This helps you find slow spots. The panel also shows you when the browser is doing too much work at once.
There are tools to check how smoothly your animations run. You can see if they’re using too much computer power. This panel helps you make your site run smoothly on all devices.
Advanced Features and Use Cases
Chrome DevTools offers powerful features for web developers. These tools help with debugging, testing, and customizing the development experience.
Debugging Tools
The Source panel in DevTools is key for JavaScript debugging. It lets developers set breakpoints to pause code execution. This helps find and fix bugs step-by-step.
The Call Stack shows the order of function calls. Watch Expressions track specific variables as code runs. These tools make it easier to understand complex scripts.
For CSS, the Elements panel highlights changes in real-time. Developers can edit styles directly in the browser. This speeds up the design process.
DevTools also provides console logging and error reporting. These features help catch and resolve issues quickly.
Security and Performance Testing
Lighthouse in DevTools checks website speed and best practices. It gives scores for performance, accessibility, and SEO. This helps developers improve site quality.
The Security panel flags potential risks. It checks for issues like mixed content and insecure passwords. This helps create safer websites.
For speed testing, the Network panel shows load times for each resource. The Performance panel records and analyzes page actions. These tools help identify slow-loading elements.
DevTools can also simulate mobile devices. This lets developers test how sites work on different screens.
Customization and Extensions
Chrome DevTools can be customized to fit different needs. The Settings panel lets users change the layout and theme. Dark mode is popular for reducing eye strain.
Keyboard shortcuts speed up common tasks. Developers can create their own commands for frequent actions.
Chrome extensions can add new features to DevTools. These might include extra debugging tools or design helpers.
Users can also create custom snippets. These are saved pieces of code that run in any page. This feature helps automate repetitive tasks.
Frequently Asked Questions
Chrome Developer Tools offer many helpful features for web developers. Here are some common questions about using these tools effectively.
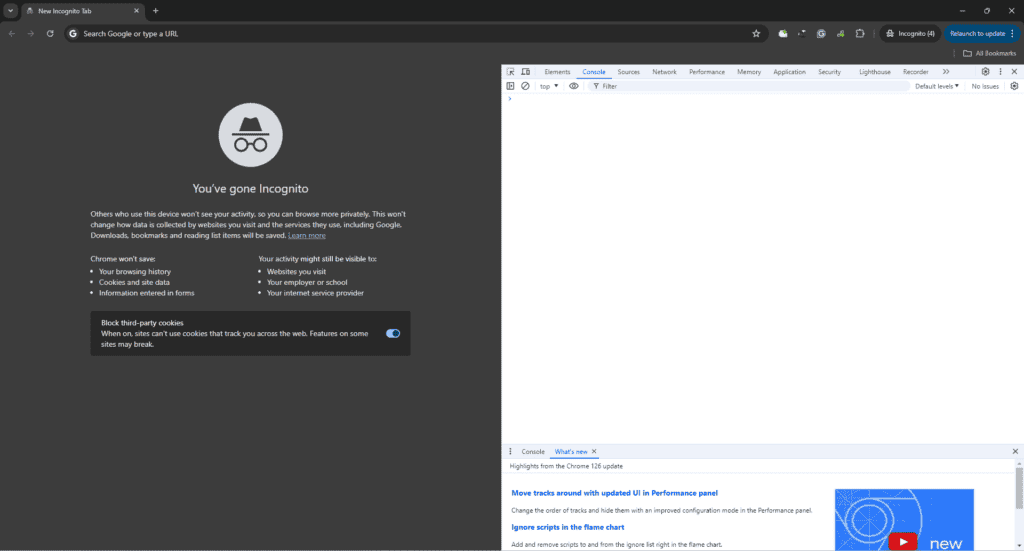
How does one access the Chrome Developer Tools?
Press F12 on your keyboard to open Chrome Developer Tools. You can also right-click on a webpage and select “Inspect” from the menu. Another option is to use the Chrome menu and go to More Tools > Developer Tools.
What shortcuts are available to navigate the Chrome Developer Tools more efficiently?
Ctrl+Shift+I (Windows/Linux) or Cmd+Option+I (Mac) opens the Developer Tools. Use Ctrl+[ and Ctrl+] to move between panels. Ctrl+Shift+P opens the Command Menu for quick access to features.
What extensions can enhance the functionality of the Chrome Developer Tools?
Several extensions boost Chrome DevTools’ capabilities. React Developer Tools help debug React apps. Redux DevTools Extension aids in managing application state. Lighthouse analyzes web app performance and accessibility.
Can you outline the purpose and benefits of using the Chrome Developer Tools?
Chrome DevTools help developers inspect and debug web pages. They allow editing HTML and CSS in real-time. DevTools also aid in testing performance and fixing JavaScript errors. These tools make it easier to create and improve websites.
What is the functionality of the Application tab within the Chrome Developer Tools?
The Application tab lets developers inspect web storage. It shows data in Local Storage, Session Storage, and IndexedDB. This tab also displays information about service workers and manifests for Progressive Web Apps.
How can developers effectively utilize the F12 Developer Tools in Chrome?
Developers can use F12 tools to examine network requests. They can debug JavaScript with breakpoints and the console. The Elements panel helps edit HTML and CSS live. Performance tools identify slow parts of a website.